Turbo Effeciency Tables
 Jan 7, 2010, 12:54 PM
#1
Evolved Member
Thread Starter
iTrader: (22)
Join Date: Nov 2003
Location: Northern KY near Cincy
Posts: 2,408
Likes: 0
Received 6 Likes
on
6 Posts
Turbo Effeciency Tables
I've been reading a lot on turbo efficiency tables and discovered that how our turbos taper off boost as RPM raises keeps them in the efficiency plateau. But in doing some calculations I discovered that if I were to have boost slightly increase as rpm raises (to a certain point), the turbo (in my case a green) maintains in the efficiency plateau as well.
So..
Through effective use of my EBC I should be able to control boost to a point that it will not taper, but slightly increase. I am only talking a psi or so. By doing this the area under the curve should fatten up considerably and mid range power should drastically increase.
Of course fuel and timing would have to be adjusted.
I am looking at a peak of 26 to 27psi by no more than 4000rpm (on the verge of the surge line) and holding to the maximum turbo rpm allowance.
Another finding was that in the midrange of my RPM 5k to 6500 I have the ability to go up to 30psi and still remain on the efficiency plateau.
Any thoughts ? ? ?
In an effort to keep clutter out and make this thread more "efficient" I pasted the explanation of efficiency tables below.
I have the latest Excel Turbo Efficiency Calculator (Thanks l2r99gst) if others want it, please PM me.
Found a GREAT article that explains it all in great detail.
Compressor map reading for dummies.
By JustinSane
A compressor map can be a daunting thing to look at, but I will show you a few simple tricks to use a turbos compressor map to learn a couple important pieces of information.
In this tutorial I will use the TD05 big 16g currently on my CRX as an example. You can download the map below and print it out to make it easier to follow the tutorial.
Lesson one- determine how much flywheel horse power a turbo can support.
Ok a few facts that your should take note of, a turbos flow is measured in CFM or IB/MIN, these are the numbers you see across the bottom of the compressor map. It takes
Approximately 1 LB/MIN to support 10 flywheel horse power. So if your HP goal is 300 flywheel horsepower you divide 300 by 10 to find out how many LB/MIN you need. So 300/10=30 so we know we need a turbo capable of flowing 30 LB/MIN to support 300 crank horse power. If the map you have don’t show the flow in IB/MIN but rather it’s in CFM then simply divide the CFM by 14.27 to convert it. Ok so we look at the map for the big 16g and notice it can flow up to 550 CFM or 38.5 IB/MIN. Remember I said that each LB/MIN can support 10 HP? So we take 38.5 and multiply it by 10 and get 385, so we now know this turbo is capable of flowing enough air to support 385 horsepower at the flywheel. One last thing you should take note of while we are looking at the turbos flow is the efficiency of the turbo at any given point. If you look at the map you can see there are loops called islands and on this map they are labeled 71,70,68,65 and 60 from the center out, this is the turbos efficiency rating the lower the rating the more heat the turbo pumps out, typically 70 and up is great. We will touch more on this later in lesson three. Let’s go to lesson two.
Lesson two- determine how well the turbo will spool.
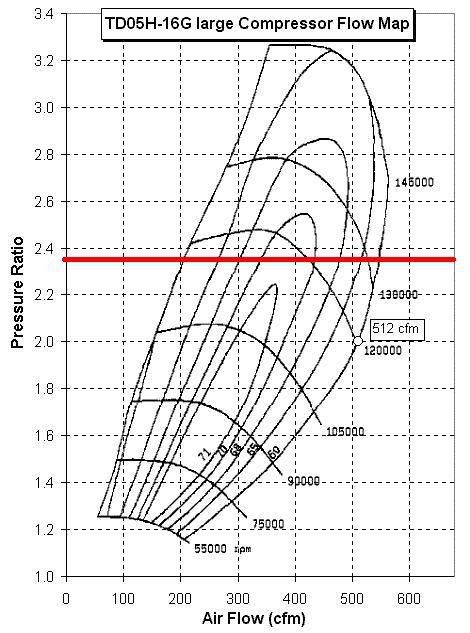
Ok we can also use the map to get a general idea on how quickly a turbo is capable of spooling up to a certain boost level, in this tutorial we will use 20 psi. If you look along the left side of a compressor map you will see the pressure ratio values. To determine where 20 PSI factors in that scale you use the following formula 14.7+boost you want to run / 14.7= pressure ratio. So we take 14.7 add it to 20 psi and get 34.7 and we divide that by 14.7 and get 2.36 so our pressure ratio for 20 psi is 2.36 so find where 2.36 is on the map and mark it like I did in red below.
Ok so this is where our goal of 20 PSI fits in on this map, next we want to see how quickly the turbo could potentially spool to 20 psi. For this we can use this calculator http://www.lovehorsepower.com/CFM1.htm to determine the CFM at any given RPM CFM Calculations so we fill in the fields with the information they ask for.
Size of engine = 1.6
VE = 90 (good conservative value for a healthy motor)
Maximum boost we want to hit = 20
Maximum engine rpm =7400
Of course these values will vary according to your application but we are using these figures for this tutorial. Any way now we look on the map for where the red line first meets up with the compressor map lines and we see it’s just about at the 210 CFM mark. So let’s draw a line down to the CFM value like I did here in blue.
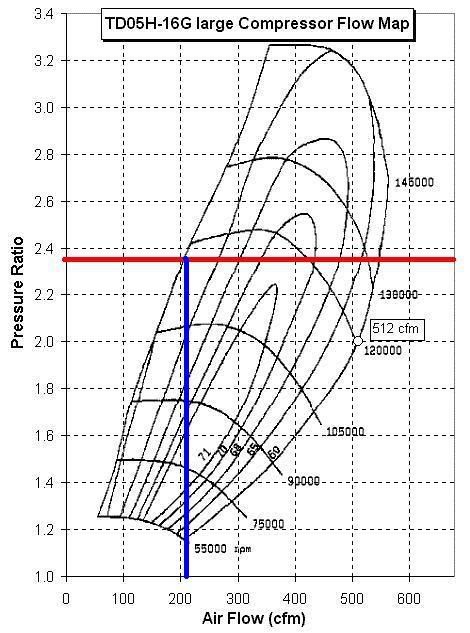
So let’s go back to the calculator find the 20 psi value along the left side and then follow that column to the right until you find 210 CFM or as close to it as you can, then follow that column up to find the RPM. So we see 210.1 CFM is in the 3500 RPM column. Great so now we know this turbo has the potential to reach 20 psi as early as 3500 RPM based on our motors specs.
Lesson three- This is a continuation of lesson one. We determined in lesson one that this turbo can support 385 flywheel horsepower, now let’s see what its actual potential is on our motor. The calculator we used above could be used again here but it only takes RPM values in increments of 500 so since our maximum RPM in this tutorial is 7400 we will do it by hand. Use the following formula, Engine size in liters x max rpm x VE x PR and then divide by 5660, so its 1.6 x 7400 x 90(good conservative value for a healthy motor)x 2.36 (the PR figure we figured up earlier in lesson two) =2514816 / 5660 = 444 ok so we now know our set up is capable of 444 cfm so lets see where it fits in on our compressor map at 20 PSI. I marked it with a yellow line.
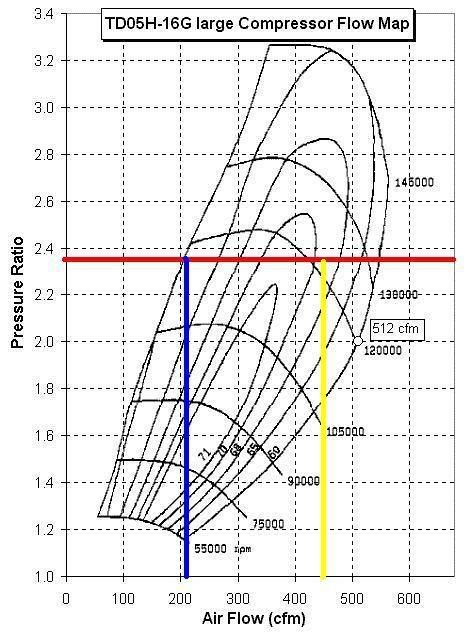
Now we have mapped this turbo to our set up . Let’s see what this can tell us, first off we already learned by the blue line that it’s a pretty fast spooling turbo on our motor but what else can we learn? Well by looking where the red and yellow intersect we can see that point is in a island that’s rated at 68% efficiency, and if you recall I said 70 and up is good, 68 isn’t real bad but its definitely not ideal so this turbo on this set up will generate a little heat. Lastly we can take the CFM figure we came up with of 444 and turn it into IB/MIN to see our potential horsepower at the flywheel. So 444 / 14.27 = 31.1 and if you recall in lesson one we can take 31.1 and multiply by 10 to get our potential crank horse power for our given motor so 31.1 x 10 = 310. Great now we know that we should be able to reach a ballpark of 310 flywheel horse power with this turbo and the values we entered for our motor. Different factors like a motors health and modifications can affect the motors VE value, 90 is just a good conservative ballpark number to use, your motor may be higher or lower. This is a good simple basic guide to reading and using compressor maps to determine spool time and potential power, I left out some stuff like determining if surge is a factor for your combo along with how the exhaust side of the turbo can also affect spool time. I hope this helps lift some of the mystery of compressor maps for some of you. Thanks for looking in. if you have any questions of want to post maps mapped for your self and have questions on feel free. also feel free to sticky this, it may help some people figure out if a turbo they found will suit their set up.
Some maps don't use CFM or LB/MIN but rather they use cubic meter per second (m3/s) i converted the typical values found on these sort of maps to CFM for you guys.
.05 = 106
.10 = 212
.15 = 317
.20 = 423
.25 = 530
.30 = 636
So..
Through effective use of my EBC I should be able to control boost to a point that it will not taper, but slightly increase. I am only talking a psi or so. By doing this the area under the curve should fatten up considerably and mid range power should drastically increase.
Of course fuel and timing would have to be adjusted.
I am looking at a peak of 26 to 27psi by no more than 4000rpm (on the verge of the surge line) and holding to the maximum turbo rpm allowance.
Another finding was that in the midrange of my RPM 5k to 6500 I have the ability to go up to 30psi and still remain on the efficiency plateau.
Any thoughts ? ? ?
In an effort to keep clutter out and make this thread more "efficient" I pasted the explanation of efficiency tables below.
I have the latest Excel Turbo Efficiency Calculator (Thanks l2r99gst) if others want it, please PM me.
Found a GREAT article that explains it all in great detail.
Compressor map reading for dummies.
By JustinSane
A compressor map can be a daunting thing to look at, but I will show you a few simple tricks to use a turbos compressor map to learn a couple important pieces of information.
In this tutorial I will use the TD05 big 16g currently on my CRX as an example. You can download the map below and print it out to make it easier to follow the tutorial.
Lesson one- determine how much flywheel horse power a turbo can support.
Ok a few facts that your should take note of, a turbos flow is measured in CFM or IB/MIN, these are the numbers you see across the bottom of the compressor map. It takes
Approximately 1 LB/MIN to support 10 flywheel horse power. So if your HP goal is 300 flywheel horsepower you divide 300 by 10 to find out how many LB/MIN you need. So 300/10=30 so we know we need a turbo capable of flowing 30 LB/MIN to support 300 crank horse power. If the map you have don’t show the flow in IB/MIN but rather it’s in CFM then simply divide the CFM by 14.27 to convert it. Ok so we look at the map for the big 16g and notice it can flow up to 550 CFM or 38.5 IB/MIN. Remember I said that each LB/MIN can support 10 HP? So we take 38.5 and multiply it by 10 and get 385, so we now know this turbo is capable of flowing enough air to support 385 horsepower at the flywheel. One last thing you should take note of while we are looking at the turbos flow is the efficiency of the turbo at any given point. If you look at the map you can see there are loops called islands and on this map they are labeled 71,70,68,65 and 60 from the center out, this is the turbos efficiency rating the lower the rating the more heat the turbo pumps out, typically 70 and up is great. We will touch more on this later in lesson three. Let’s go to lesson two.
Lesson two- determine how well the turbo will spool.
Ok we can also use the map to get a general idea on how quickly a turbo is capable of spooling up to a certain boost level, in this tutorial we will use 20 psi. If you look along the left side of a compressor map you will see the pressure ratio values. To determine where 20 PSI factors in that scale you use the following formula 14.7+boost you want to run / 14.7= pressure ratio. So we take 14.7 add it to 20 psi and get 34.7 and we divide that by 14.7 and get 2.36 so our pressure ratio for 20 psi is 2.36 so find where 2.36 is on the map and mark it like I did in red below.
Ok so this is where our goal of 20 PSI fits in on this map, next we want to see how quickly the turbo could potentially spool to 20 psi. For this we can use this calculator http://www.lovehorsepower.com/CFM1.htm to determine the CFM at any given RPM CFM Calculations so we fill in the fields with the information they ask for.
Size of engine = 1.6
VE = 90 (good conservative value for a healthy motor)
Maximum boost we want to hit = 20
Maximum engine rpm =7400
Of course these values will vary according to your application but we are using these figures for this tutorial. Any way now we look on the map for where the red line first meets up with the compressor map lines and we see it’s just about at the 210 CFM mark. So let’s draw a line down to the CFM value like I did here in blue.
So let’s go back to the calculator find the 20 psi value along the left side and then follow that column to the right until you find 210 CFM or as close to it as you can, then follow that column up to find the RPM. So we see 210.1 CFM is in the 3500 RPM column. Great so now we know this turbo has the potential to reach 20 psi as early as 3500 RPM based on our motors specs.
Lesson three- This is a continuation of lesson one. We determined in lesson one that this turbo can support 385 flywheel horsepower, now let’s see what its actual potential is on our motor. The calculator we used above could be used again here but it only takes RPM values in increments of 500 so since our maximum RPM in this tutorial is 7400 we will do it by hand. Use the following formula, Engine size in liters x max rpm x VE x PR and then divide by 5660, so its 1.6 x 7400 x 90(good conservative value for a healthy motor)x 2.36 (the PR figure we figured up earlier in lesson two) =2514816 / 5660 = 444 ok so we now know our set up is capable of 444 cfm so lets see where it fits in on our compressor map at 20 PSI. I marked it with a yellow line.
Now we have mapped this turbo to our set up . Let’s see what this can tell us, first off we already learned by the blue line that it’s a pretty fast spooling turbo on our motor but what else can we learn? Well by looking where the red and yellow intersect we can see that point is in a island that’s rated at 68% efficiency, and if you recall I said 70 and up is good, 68 isn’t real bad but its definitely not ideal so this turbo on this set up will generate a little heat. Lastly we can take the CFM figure we came up with of 444 and turn it into IB/MIN to see our potential horsepower at the flywheel. So 444 / 14.27 = 31.1 and if you recall in lesson one we can take 31.1 and multiply by 10 to get our potential crank horse power for our given motor so 31.1 x 10 = 310. Great now we know that we should be able to reach a ballpark of 310 flywheel horse power with this turbo and the values we entered for our motor. Different factors like a motors health and modifications can affect the motors VE value, 90 is just a good conservative ballpark number to use, your motor may be higher or lower. This is a good simple basic guide to reading and using compressor maps to determine spool time and potential power, I left out some stuff like determining if surge is a factor for your combo along with how the exhaust side of the turbo can also affect spool time. I hope this helps lift some of the mystery of compressor maps for some of you. Thanks for looking in. if you have any questions of want to post maps mapped for your self and have questions on feel free. also feel free to sticky this, it may help some people figure out if a turbo they found will suit their set up.
Some maps don't use CFM or LB/MIN but rather they use cubic meter per second (m3/s) i converted the typical values found on these sort of maps to CFM for you guys.
.05 = 106
.10 = 212
.15 = 317
.20 = 423
.25 = 530
.30 = 636
Last edited by Appauldd; Jan 12, 2010 at 09:35 AM. Reason: Adding findings to the OP.
 Jan 7, 2010, 01:08 PM
#2

Where did you get the compressor map for the green?
The stock turbo tapers boost because it is basically riding the choke flow down the compressor map. Nothing you do (even welding the wastegate shut) will be able to hold more than a certain amount of boost to redline. It's just the limitation of the compressor wheel.
The stock turbo tapers boost because it is basically riding the choke flow down the compressor map. Nothing you do (even welding the wastegate shut) will be able to hold more than a certain amount of boost to redline. It's just the limitation of the compressor wheel.
Jan 7, 2010, 01:14 PM
#4
Jan 7, 2010, 01:18 PM
#5
Post the 20g map that you are using and I can tell you approximately what boost you should be able to hold to redline and the calcs as to how I figured it out.
I can guarantee you though, that you are aren't staying in an 'efficient' island. It is most likely going to approach the choke limit as well.
You can look on this site for a compressor map calculator spreadsheet that I and others have posted as well. A very quick and easy way to see where you are landing on the maps. I'm pretty sure both the 50trim and 20g maps are in there.
Edit: I just looked at the 20g map that I have in that spreadsheet. Your numbers are way out of the map. So, my guess is that the green's compressor map isn't the same map or you won't achieve what you are trying to do.
Last edited by l2r99gst; Jan 7, 2010 at 01:44 PM.
Jan 7, 2010, 02:19 PM
#6
Evolved Member
Thread Starter
iTrader: (22)
Join Date: Nov 2003
Location: Northern KY near Cincy
Posts: 2,408
Likes: 0
Received 6 Likes
on
6 Posts
http://www.stealth316.com/images/td06h-20g-cfm.gif
http://www.turbofast.com.au/img/to4e-50.JPG
Those are the ones I was using.
http://www.turbofast.com.au/img/to4e-50.JPG
Those are the ones I was using.
Jan 7, 2010, 03:35 PM
#7
Evolved Member
Thread Starter
iTrader: (22)
Join Date: Nov 2003
Location: Northern KY near Cincy
Posts: 2,408
Likes: 0
Received 6 Likes
on
6 Posts
At 4200 rpm I can be at 26psi and still be one within the surge line....that is, of course if my VE calculation is correct.
The goal is to try and have about 20 psi by 3500 rpm. Again, this would be on the verge of the surge line.
The problem I see is how do I get this amount of boost to come on so quickly? I am pretty close, but not quite there.
The goal is to try and have about 20 psi by 3500 rpm. Again, this would be on the verge of the surge line.
The problem I see is how do I get this amount of boost to come on so quickly? I am pretty close, but not quite there.
Trending Topics
Jan 7, 2010, 03:49 PM
#8
Just curious, how are you accounting for pressure losses upstream of the compressor discharge? Are you setting boost based on that or MAP? Or is it a good assumption that your losses are insignificant?
Jan 7, 2010, 03:59 PM
#9
Yes, that is the same 20g map that I have. I don't know if the green has that wheel...if so, you can't do what you want.
Let me find the thread with the compressor map calculator. It will help you out a ton without having to run all of the manual calcs. I added the Evo VIII 16g as well.
Edit: Here you go. Post #4 has a download to the single file, so you don't have to download the parts that I posted.
Eric
Let me find the thread with the compressor map calculator. It will help you out a ton without having to run all of the manual calcs. I added the Evo VIII 16g as well.
Edit: Here you go. Post #4 has a download to the single file, so you don't have to download the parts that I posted.
Eric
Last edited by l2r99gst; Jan 7, 2010 at 04:04 PM.
Jan 7, 2010, 05:15 PM
#10
Awesome info, thanks!! Has anyone created a spreadsheet that estimates transition through the map?
I had started something a while back but gave up. I was trying to do something similar to you Applaudd, to see at what point it was not worth pushing the stock turbo.
I had started something a while back but gave up. I was trying to do something similar to you Applaudd, to see at what point it was not worth pushing the stock turbo.
Jan 7, 2010, 05:37 PM
#11
I was thinking about this for sometime also, and it seems 550 CFM is a reasonable limit for 16G6 EVO 8 turbo. (at 70% efficiency) If we do not mind rotating turbo upto 145000rpm which is the maximum shown at the map, then 615 CFM or so might be the limit, but I guess that is not what we should aim for. 550 CFM is about 303 g/s, and it may depend on the mods and other environmental variables, but 230 load @ 7000 rpm is about 282 g/s. So I guess there is about 8% more room. But unless I can efficiently cool the charge temp down, more air flow does not always mean more power. That is probably why many gurus here are saying that 19~20 psi @ redline is reasonable limit with stock turbo.
Last edited by ace33joe; Jan 7, 2010 at 05:42 PM.
Jan 7, 2010, 06:10 PM
#12
Here's a rough trace from one of my last logs, maxing out the stock turbo on E85. This was a 32psi spike to 22psi at redline. I only plotted the points from 4000 to 7000RPM:

As mentioned before, I'm maxing it out. I'm trying to run as much boost as possible. It's just limited by the compressor wheel now.
Eric
As mentioned before, I'm maxing it out. I'm trying to run as much boost as possible. It's just limited by the compressor wheel now.
Eric
Jan 7, 2010, 06:50 PM
#13
Ahh I see now, so they are one and the same. I just saw the first tab with all the inputs. I was trying to do the same thing, but this has already been done thanks!!
I'd say you have just about maxed that turbo out lol
I'd say you have just about maxed that turbo out lol
Jan 7, 2010, 07:07 PM
#15
Higher VE cars at the top end won't be able to hold as much boost as a lower VE car (on a maxed out turbo). For example, with my cutout open I was able to hold about 22 psi, with it closed I was able to hold 23 psi, because my VE was lower with the cutout closed.
If you are maxing out the turbo though you can sort of see what your VE is as it will follow the line down the map.
Last edited by l2r99gst; Jan 7, 2010 at 07:11 PM.

